Automatically generate a diagram of your infrastructure from Ansible inventory
Published on
Another post about Ansible. This time I will talk about generating a representation of your infrastructure, for documentation purpose, using your Ansible inventory and gathered facts.
I had to update the infrastructure diagram of the Services FACiLes project, it was deprecated and, inevitably, will still be in a few months because we keep adding new containers and services. That’s a common issue in tech documentation.
Moreover, manually editing a graph isn’t a thing I usually like to do, especially when elements, relations and additional text can more easily be declared in a text file using a definition language. I found for instance this tool (not tested) which allows you to describe what you want to graph using a YAML file and then use graphviz to draw the resulting diagram. But, wait, I already have this kind of structured data, it’s in my Ansible inventory file.
I then thought about writing an equivalent tool to draw a diagram representing Ansible hosts and groups declared in the inventory and their facts and variables. Of course, someone else already had this idea, and this is called ansible-inventory-grapher. This python tool produces graphviz code that you can directly pipe to graphviz to generate a png or svg file.
As an example, here is how the graph of our infrastructure looks like:
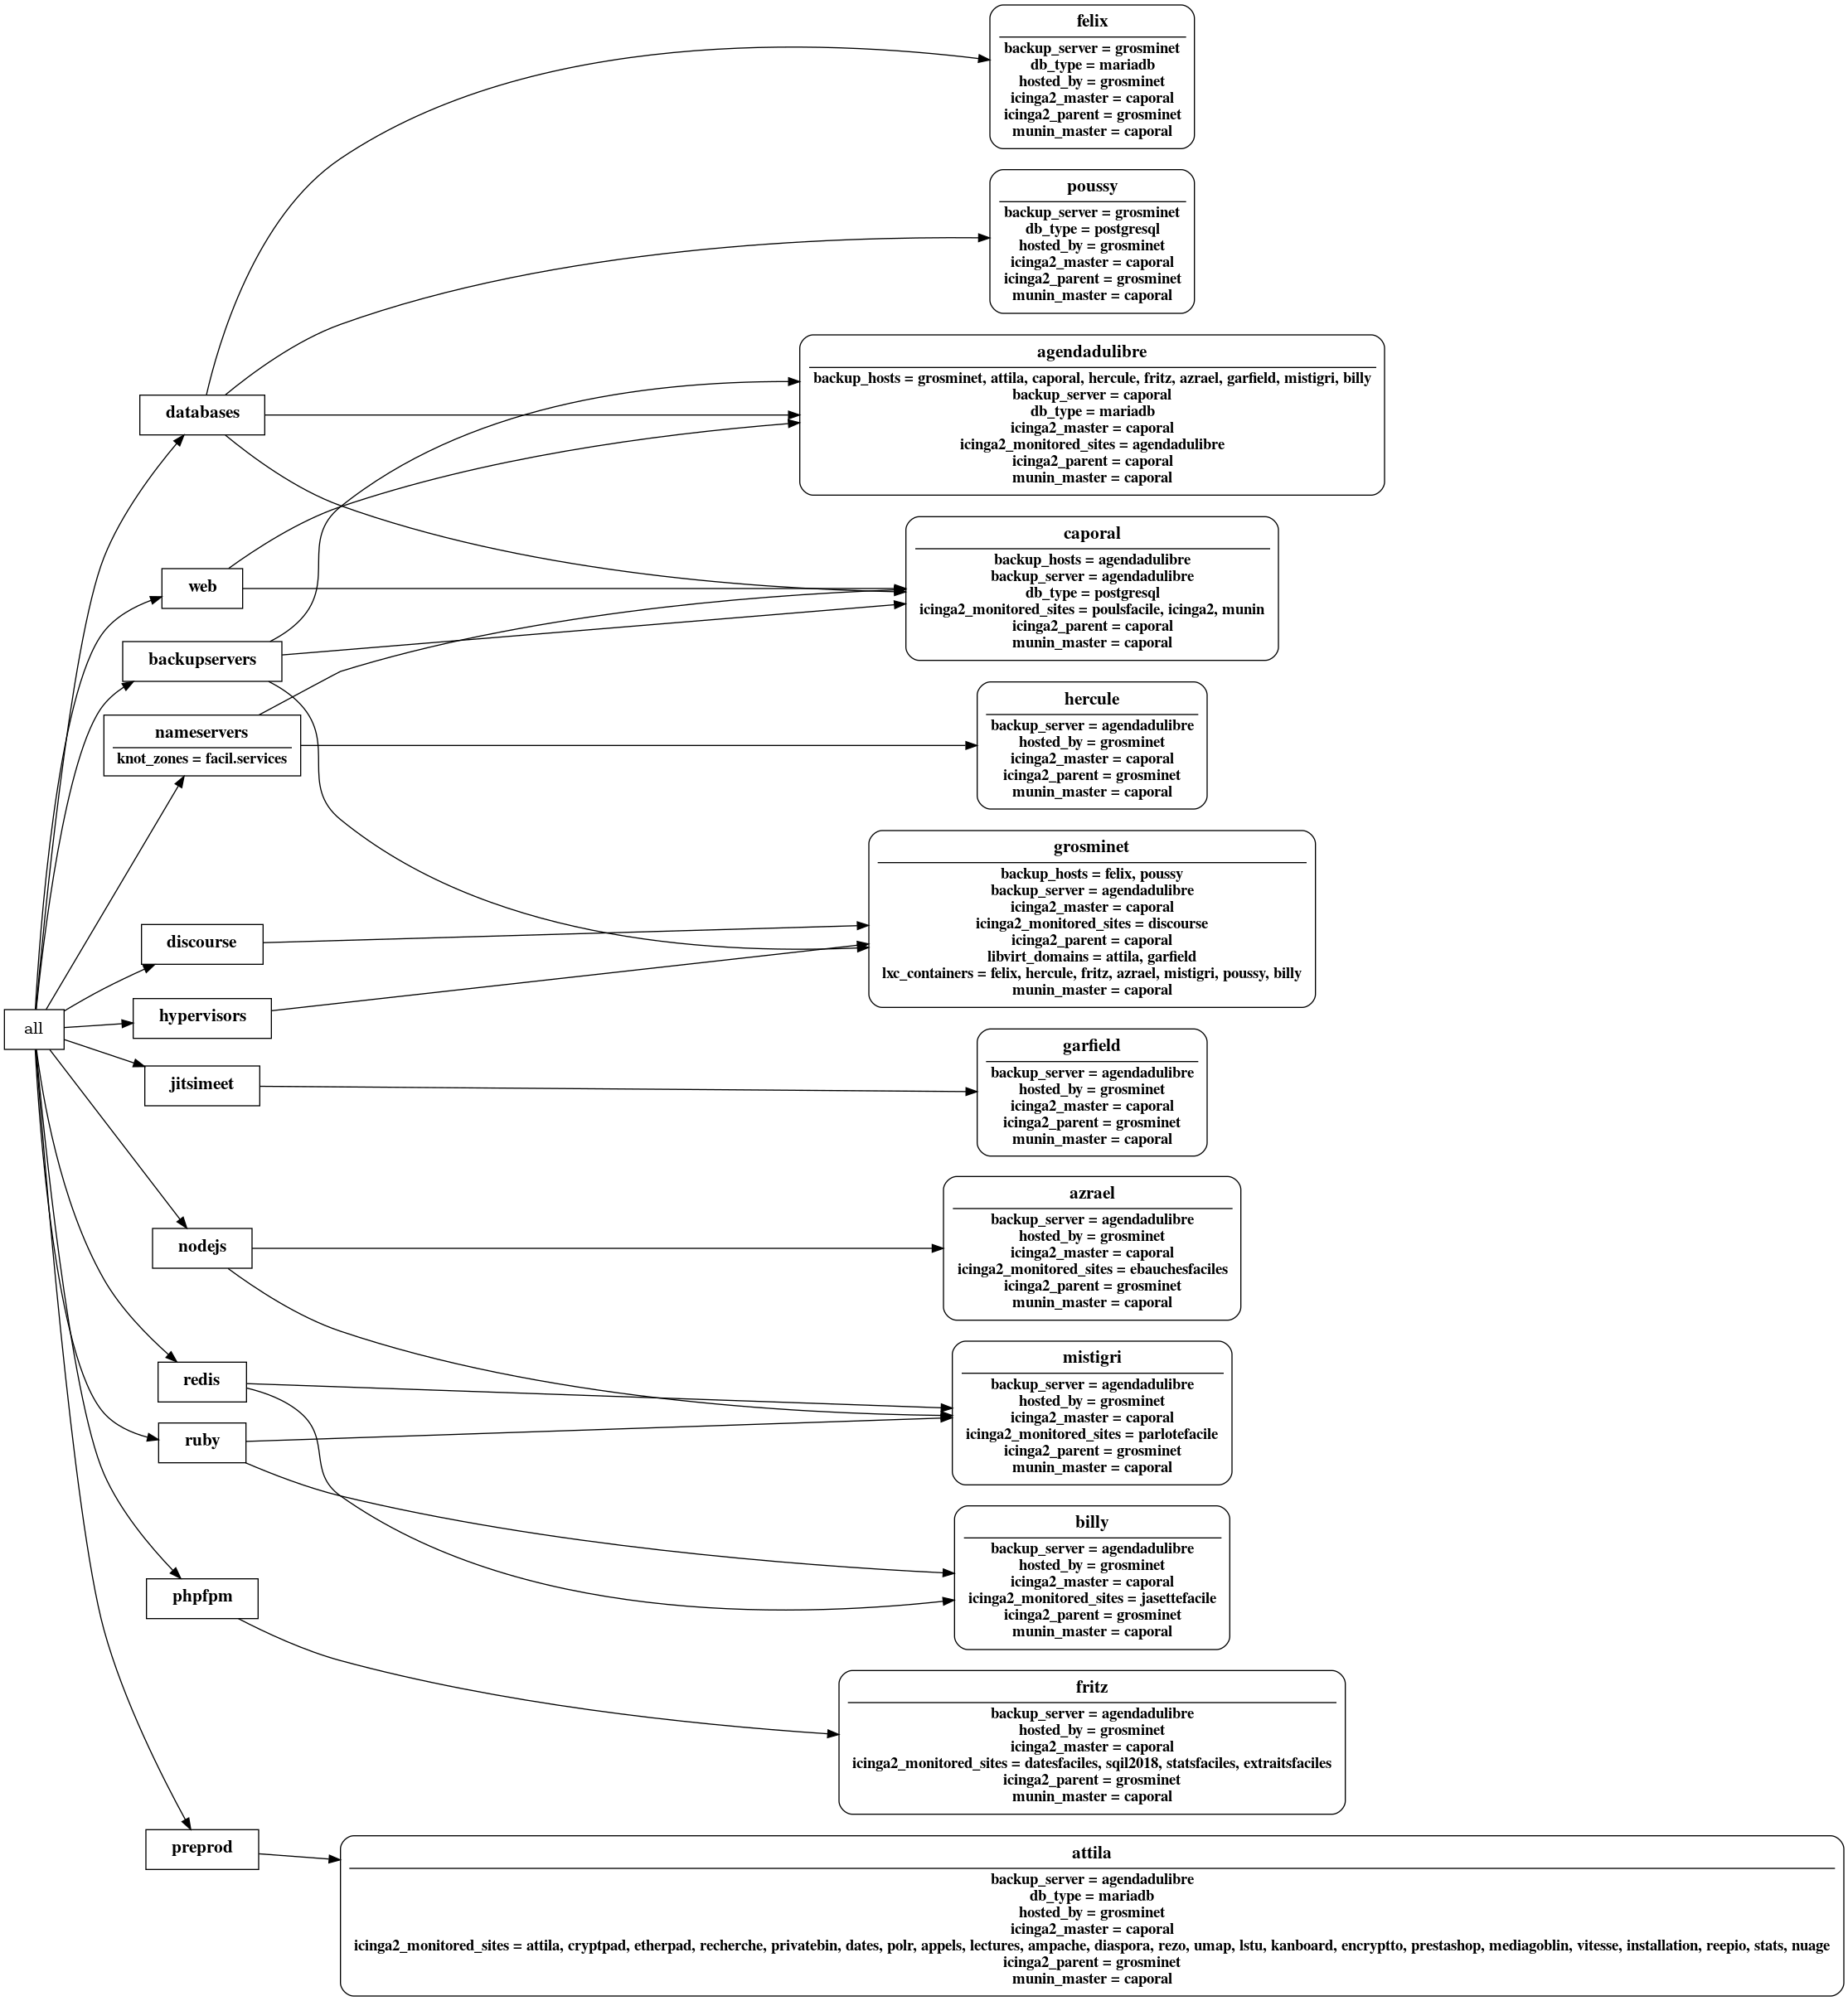
ansible-inventory-grapher doesn’t show value of variables but you can use [this fork]((https://github.com/eking-go/ansible-inventory-grapher/tree/variables_with_value) merge request pending) to have them on your graph. You should also enable fact caching in your ansible.cfg and gather your server’s facts before running ansible-inventory-grapher. Else you will only have variables declared in host_vars/ and group_vars/.
The default jinja2 template used to generate the code suitable for graphviz prints all variables and facts, but I was only interested by some of them (those passed to the --visible-vars actually) so I slighty modified the template as follow:
--- doc/ansible-inventory-graph.default.j2
+++ doc/ansible-inventory-graph.j2
@@ -8,7 +8,7 @@
   <tr><td><b>
   <font face="Times New Roman, Bold" point-size="16">{{ node.name}}</font>
   </b></td></tr>
-{% if node.vars and showvars %}<hr/><tr><td><font face="Times New Roman, Bold" point-size="14">{% for var in node.vars|sort %}{{var}}{% if var in visible_vars %} = {{node.vars[var]}}{% endif %}<br/>{%endfor %}</font></td></tr>{% endif %}
+{% if node.vars and showvars %}<hr/><tr><td><font face="Times New Roman, Bold" point-size="14">{% for var in node.vars|sort %}{% if var in visible_vars %}{{var}} = {% if node.vars[var] is iterable and node.vars[var] is not string %}{{ node.vars[var]|map(attribute='name')|join(', ') }}{% else %}{{node.vars[var]}}{% endif %}<br/>{% endif %}{% else %}<br />{%endfor %}</font></td></tr>{% endif %}
 </table>
 >]
 {% else %}
@@ -17,7 +17,7 @@
   <tr><td><b>
   <font face="Times New Roman, Bold" point-size="16">{{ node.name}}</font>
   </b></td></tr>
-{% if node.vars and showvars %}<hr/><tr><td><font face="Times New Roman, Bold" point-size="14">{% for var in node.vars|sort %}{{var}}{% if var in visible_vars %} = {{node.vars[var]}}{% endif %}<br/>{%endfor %}</font></td></tr>{% endif %}
+{% if node.vars and showvars %}<hr/><tr><td><font face="Times New Roman, Bold" point-size="14">{% for var in node.vars|sort %}{% if var in visible_vars %}{{var}} = {% if node.vars[var] is iterable %}{{ node.vars[var]|map(attribute='name')|join(', ') }}{% else %}{{node.vars[var]}}{% endif %}<br/>{% endif %}{% else %}<br />{% endfor %}</font></td></tr>{% endif %}
 </table>
 >]
 {% endif %}{% endfor %}
@@ -26,3 +26,5 @@
   {{ edge.source|labelescape }} -> {{ edge.target|labelescape }};
 {% endfor %}
 }
Finally, I wrote a simple Makefile to easily update the graph when inventory is updated:
# Clear out default implicit rules and variables.
MAKEFLAGS += --no-builtin-rules --no-builtin-variables

.PHONY: inventory-graph

inventory-graph: doc/ansible-inventory-graph.png

doc/ansible-inventory-graph.png: inventory/hosts $(wildcard inventory/group_vars/*.yml) $(wildcard inventory/host_vars/*.yml)
   ansible -i inventory/ -m setup all >/dev/null
   ~/src/ansible-inventory-grapher/bin/ansible-inventory-grapher -i inventory/ -t doc/ansible-inventory-graph.j2 -a "rankdir=LR;" \
   --visible-vars knot_zones \
   --visible-vars backup_server \
   --visible-vars munin_master \
   --visible-vars icinga2_master \
   --visible-vars icinga2_parent \
   --visible-vars backup_hosts \
   --visible-vars icinga2_monitored_sites \
   --visible-vars db_type \
   --visible-vars hosted_by \
   --visible-vars libvirt_domains \
   --visible-vars lxc_containers \
   --visible-vars ansible_architecture \
   --visible-vars ansible_default_ipv4.address \
   --visible-vars ansible_default_ipv6.address \
   --visible-vars ansible_distribution \
   --visible-vars ansible_distribution_version \
   --visible-vars ansible_memtotal_mb \
   --visible-vars ansible_processor_vcpus \
   --visible-vars ansible_virtualization_role \
   --visible-vars ansible_virtualization_type \
   all | dot -T png >$@
That way, when we add a new machine or make any change in our infra, all we need to do is make inventory-graph and commit the resulting graph. The image file is linked in our documentation in our private wiki, thus we are ensured that it is always up to date!