Another post about Ansible. This time I will talk about generating a representation of your infrastructure, for documentation purpose, using your Ansible inventory and gathered facts.
I had to update the infrastructure diagram of the Services FACiLes project, it was deprecated and, inevitably, will still be in a few months because we keep adding new containers and services. That's a common issue in tech documentation.
Moreover, manually editing a graph isn't a thing I usually like to do, especially when elements, relations and additional text can more easily be declared in a text file using a definition language. I found for instance this tool (not tested) which allows you to describe what you want to graph using a YAML file and then use graphviz to draw the resulting diagram. But, wait, I already have this kind of structured data, it's in my Ansible inventory file.
I then thought about writing an equivalent tool to draw a diagram representing Ansible hosts and groups declared in the inventory and their facts and variables. Of course, someone else already had this idea, and this is called ansible-inventory-grapher. This python tool produces graphviz code that you can directly pipe to graphviz to generate a png or svg file.
As an example, here is how the graph of our infrastructure looks like:
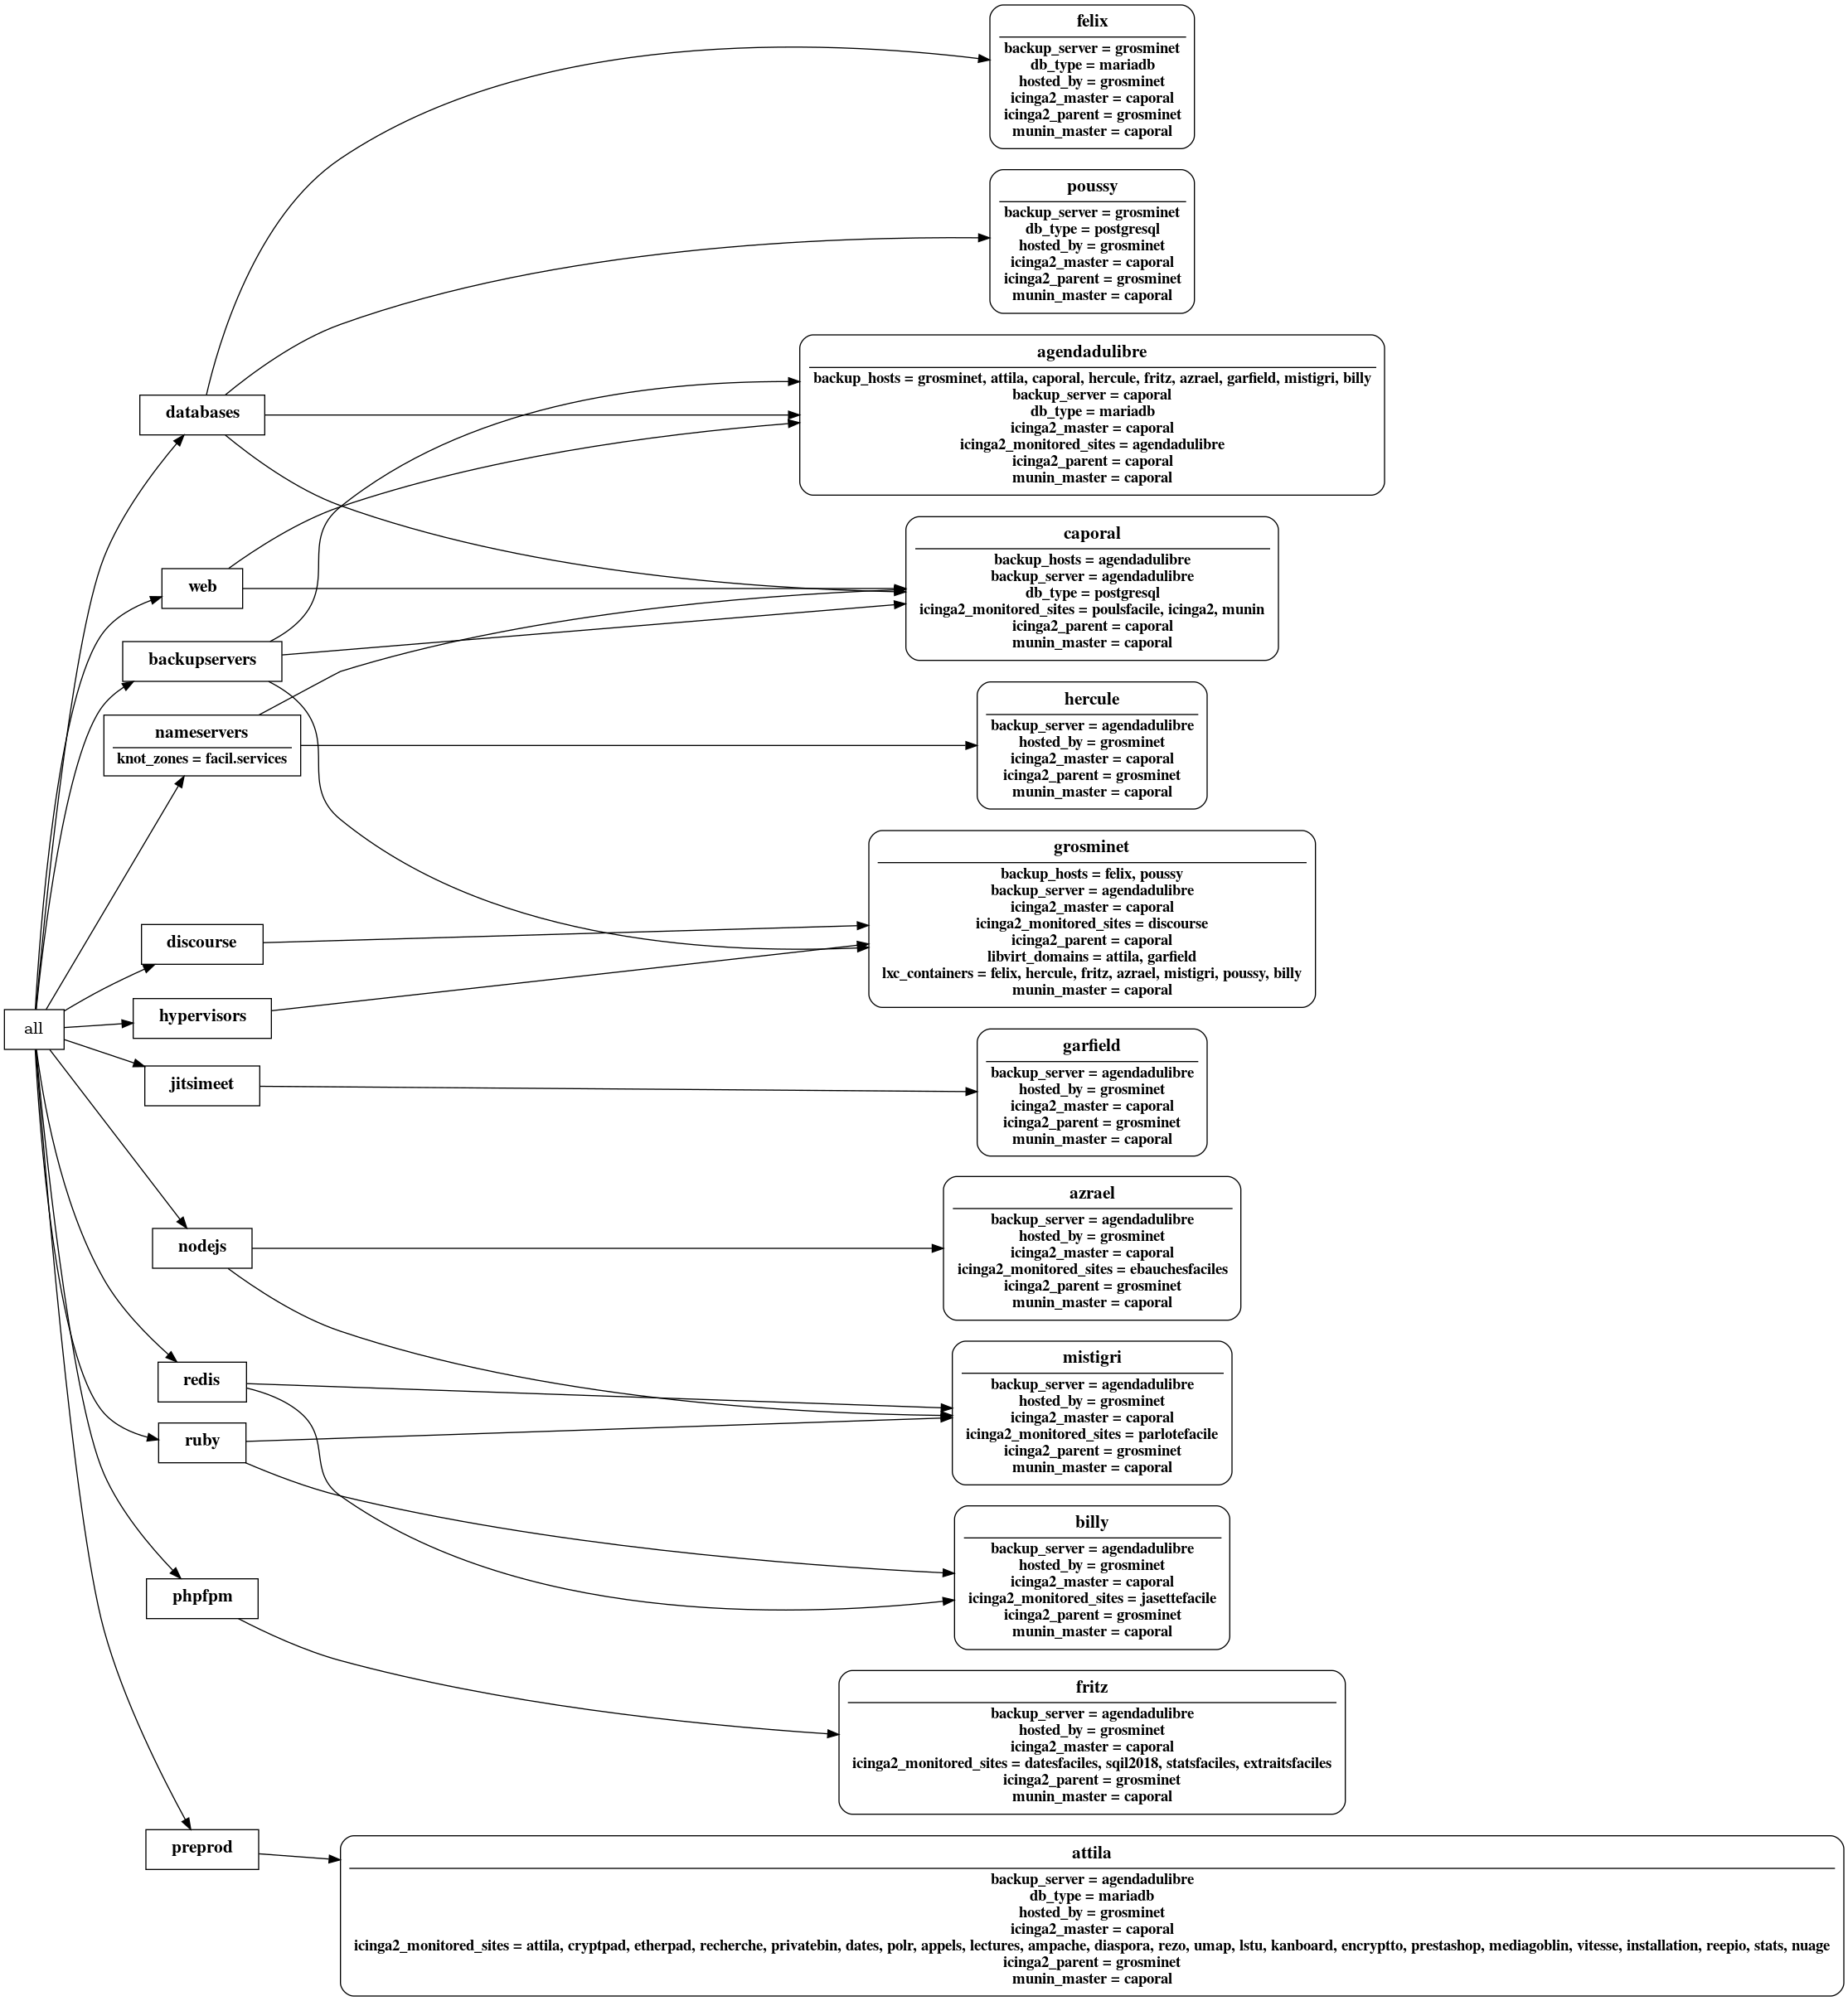
ansible-inventory-grapher doesn't show value of variables but you can use this
fork(
merge request
pending) to
have them on your graph.
You should also enable fact caching in your ansible.cfg and gather your server's facts before running ansible-inventory-grapher. Else you will only have variables declared in host_vars/ and group_vars/.
The default jinja2 template used to generate the code suitable for graphviz prints all variables and facts, but I was only interested by some of them (those passed to the --visible-vars actually) so I slighty modified the template as follow:
--- doc/ansible-inventory-graph.default.j2
+++ doc/ansible-inventory-graph.j2
@@ -8,7 +8,7 @@
   <tr><td><b>
   <font face="Times New Roman, Bold" point-size="16">{{ node.name}}</font>
   </b></td></tr>
-{% if node.vars and showvars %}<hr/><tr><td><font face="Times New Roman, Bold" point-size="14">{% for var in node.vars|sort %}{{var}}{% if var in visible_vars %} = {{node.vars[var]}}{% endif %}<br/>{%endfor %}</font></td></tr>{% endif %}
+{% if node.vars and showvars %}<hr/><tr><td><font face="Times New Roman, Bold" point-size="14">{% for var in node.vars|sort %}{% if var in visible_vars %}{{var}} = {% if node.vars[var] is iterable and node.vars[var] is not string %}{{ node.vars[var]|map(attribute='name')|join(', ') }}{% else %}{{node.vars[var]}}{% endif %}<br/>{% endif %}{% else %}<br />{%endfor %}</font></td></tr>{% endif %}
 </table>
 >]
 {% else %}
@@ -17,7 +17,7 @@
   <tr><td><b>
   <font face="Times New Roman, Bold" point-size="16">{{ node.name}}</font>
   </b></td></tr>
-{% if node.vars and showvars %}<hr/><tr><td><font face="Times New Roman, Bold" point-size="14">{% for var in node.vars|sort %}{{var}}{% if var in visible_vars %} = {{node.vars[var]}}{% endif %}<br/>{%endfor %}</font></td></tr>{% endif %}
+{% if node.vars and showvars %}<hr/><tr><td><font face="Times New Roman, Bold" point-size="14">{% for var in node.vars|sort %}{% if var in visible_vars %}{{var}} = {% if node.vars[var] is iterable %}{{ node.vars[var]|map(attribute='name')|join(', ') }}{% else %}{{node.vars[var]}}{% endif %}<br/>{% endif %}{% else %}<br />{% endfor %}</font></td></tr>{% endif %}
 </table>
 >]
 {% endif %}{% endfor %}
@@ -26,3 +26,5 @@
   {{ edge.source|labelescape }} -> {{ edge.target|labelescape }};
 {% endfor %}
 }
Finally, I wrote a simple Makefile to easily update the graph when inventory is updated:
# Clear out default implicit rules and variables.
MAKEFLAGS += --no-builtin-rules --no-builtin-variables

.PHONY: inventory-graph

inventory-graph: doc/ansible-inventory-graph.png

doc/ansible-inventory-graph.png: inventory/hosts $(wildcard inventory/group_vars/*.yml) $(wildcard inventory/host_vars/*.yml)
    ansible -i inventory/ -m setup all >/dev/null
    ~/src/ansible-inventory-grapher/bin/ansible-inventory-grapher -i inventory/ -t doc/ansible-inventory-graph.j2 -a "rankdir=LR;" \
    --visible-vars knot_zones \
    --visible-vars backup_server \
    --visible-vars munin_master \
    --visible-vars icinga2_master \
    --visible-vars icinga2_parent \
    --visible-vars backup_hosts \
    --visible-vars icinga2_monitored_sites \
    --visible-vars db_type \
    --visible-vars hosted_by \
    --visible-vars libvirt_domains \
    --visible-vars lxc_containers \
    --visible-vars ansible_architecture \
    --visible-vars ansible_default_ipv4.address \
    --visible-vars ansible_default_ipv6.address \
    --visible-vars ansible_distribution \
    --visible-vars ansible_distribution_version \
    --visible-vars ansible_memtotal_mb \
    --visible-vars ansible_processor_vcpus \
    --visible-vars ansible_virtualization_role \
    --visible-vars ansible_virtualization_type \
    all | dot -T png >$@
That way, when we add a new machine or make any change in our infra, all we
need to do is make inventory-graph and commit the resulting graph. The image
file is linked in our documentation in our private wiki, thus we are ensured
that it is always up to date!